Cost to Dashboard
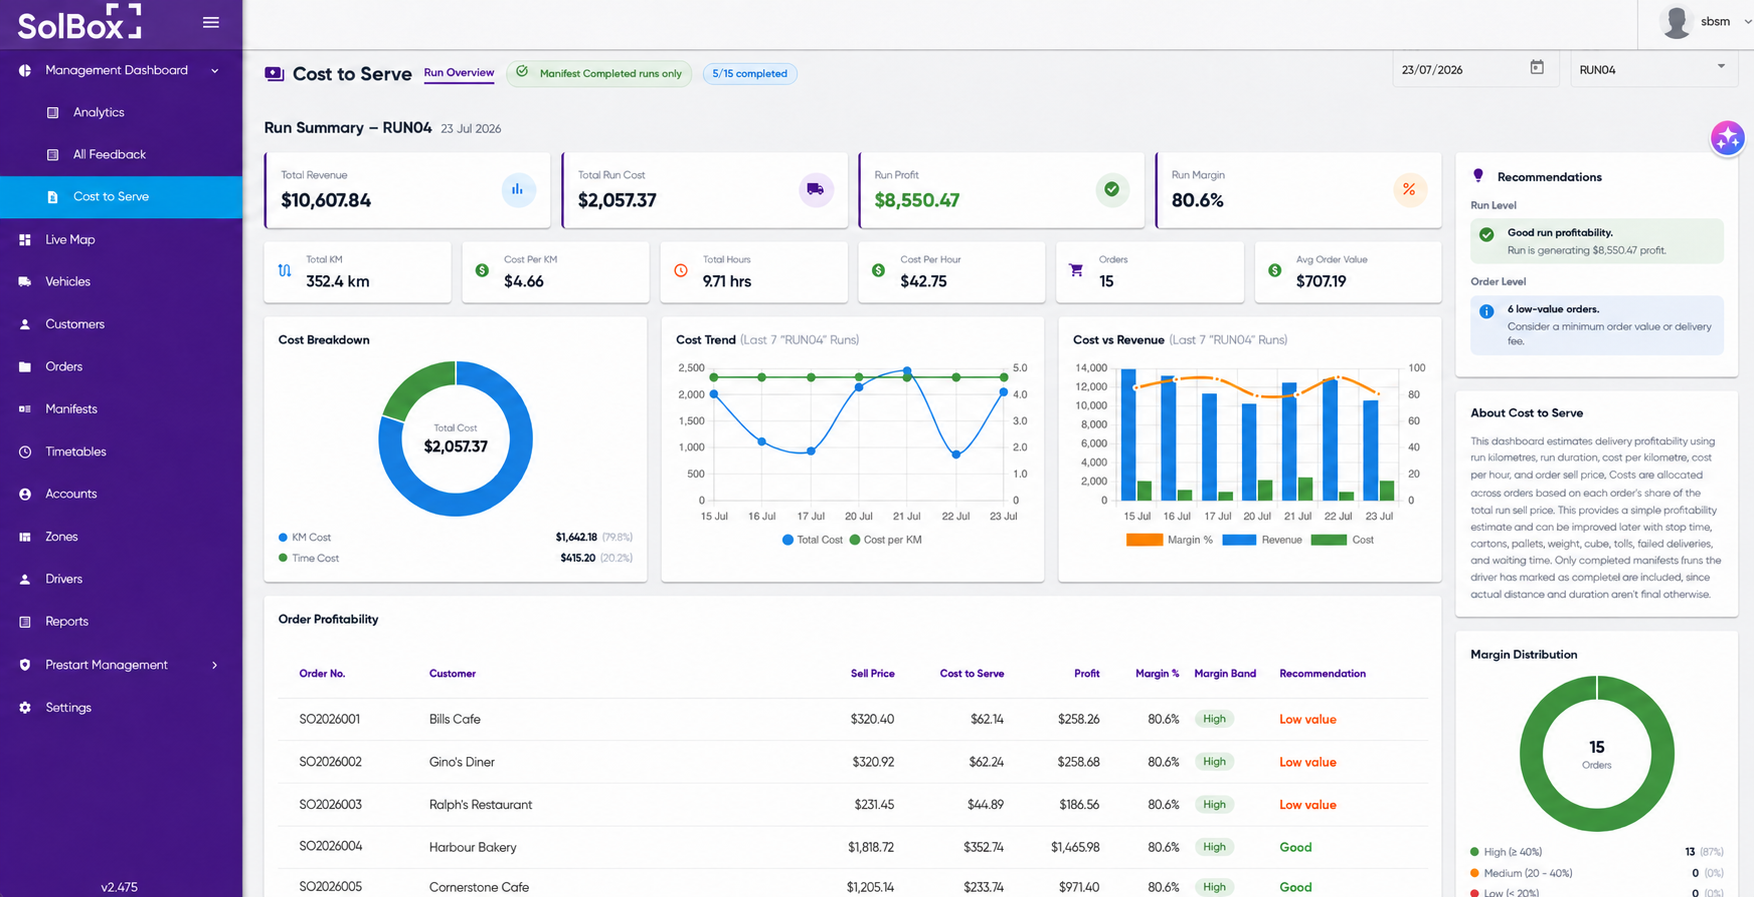
Cost to Serve dashboard: Understand delivery profitability
The Cost to Serve dashboard helps you compare order revenue with the estimated cost of completing your deliveries. It gives you a clearer view of profitability at both the delivery run and individual order level.
The dashboard is currently in beta with future updates to come and is available on request. Contact SolBox Support to have it enabled for your account.
What can the dashboard tell you?
For each completed delivery run, the dashboard can show:
Total revenue
Estimated run cost
Estimated profit and profit margin
Total distance and delivery hours
Cost per kilometre and cost per hour
Average order value
Cost trends across recent runs
Revenue, cost and margin comparisons
Estimated profitability for individual orders
Recommendations that may help you identify low-value or less-profitable deliveries
These insights can help you understand which runs and orders are performing well and where pricing, delivery fees, routing or operating costs may need further review.
How are delivery costs calculated?
The dashboard uses two configurable operating costs:
Driver cost per hour: The estimated hourly cost of the driver completing the run.
Vehicle cost per kilometre: The estimated cost of operating the vehicle for each kilometre travelled.
You can use either one of these costs or both. Providing both produces a more complete estimate.
For example:
Estimated run cost = driver time cost + vehicle distance cost
The dashboard then compares the estimated run cost with the revenue recorded against the orders on that run.
Run costs are allocated across the orders using each order’s share of the total run revenue. This provides an estimated cost, profit and margin for each order.
The figures are estimates intended to support operational and commercial decision-making. They may not include every business expense associated with delivering an order.
Before using the dashboard
Complete the following setup to get meaningful results.
1. Enter the driver’s hourly rate
Add the hourly amount you want the dashboard to use when estimating driver costs.
This could represent wages alone or a broader internal rate that includes on-costs. Use an approach that is consistent with how your business evaluates delivery costs.
Video: How to enter a driver cost per hour
2. Enter the vehicle’s cost per kilometre
Add the per-kilometre rate you want the dashboard to use when estimating vehicle operating costs.
Depending on your internal costing method, this rate might account for expenses such as fuel, servicing, tyres, registration, insurance, depreciation or leasing.
Video: How to enter a vehicle cost per kilometre
3. Include revenue on every order
Each order must have an order revenue or sell price recorded.
Without this information, the dashboard cannot accurately compare revenue with delivery cost or calculate estimated profit and margin. For the best results, make sure revenue is entered consistently for every order.
Please contact SolBox Support if this information is not being passed on your integration
4. Complete manifests using the new process
Drivers need to complete their manifests using the new manifest completion process.
The Cost to Serve dashboard uses completed manifests so that actual run distance and duration can be included in its calculations. Runs that have not been completed correctly may be missing from the dashboard or may not produce reliable results.
Only orders marked as completed by the driver are included in the completed-run calculations.
Video: How drivers complete a manifest
5. Request access
The Cost to Serve dashboard is currently a beta feature and must be enabled for your account.
Contact SolBox Support or your account manager and ask for access to the Cost to Serve dashboard.
Reading the dashboard
Run Summary
The Run Summary provides a high-level view of a selected completed run, including its:
Total revenue
Total estimated cost
Estimated profit
Estimated margin
Distance travelled
Delivery hours
Number of orders
Average order value
Use the date and run selectors to review different completed runs.
Cost Breakdown
The Cost Breakdown shows how much of the estimated run cost came from:
Distance-based vehicle costs
Time-based driver costs
This can help you see whether time or distance has the greater effect on the cost of a run.
Cost and profitability trends
The trend charts let you compare recent runs and see how cost, revenue and margin change over time.
These charts may help you identify:
Runs with unusually high costs
Changes in cost per kilometre
Changes in delivery margin
Opportunities to improve routes or consolidate deliveries
Differences between high- and low-performing runs
Order Profitability
The Order Profitability table provides an estimate for each completed order, including:
Order revenue or sell price
Allocated cost to serve
Estimated profit
Estimated margin
Margin band
Recommendations
This can help you identify orders that may require a minimum order value, delivery fee, pricing review or a different delivery approach.
Recommendations
The dashboard may highlight potential opportunities at the run or order level, such as low-value orders or runs with weaker profitability.
Recommendations are intended as prompts for further investigation. Consider them alongside your customer relationships, service commitments and other operating expenses before making commercial decisions.
Getting the most useful results
For reliable and consistent insights:
Enter both driver and vehicle rates where possible.
Use rates that reflect your organisation’s preferred costing method.
Record revenue on every order.
Keep order revenue accurate and up to date.
Make sure drivers complete every manifest using the new process.
Review the dashboard regularly rather than relying on a single run.
Compare similar routes, customers and delivery types.
Treat the results as estimates and consider other overheads when making decisions.
Frequently asked questions
Can I use the dashboard with only one cost rate?
Yes. You can enter only a driver hourly rate or only a vehicle kilometre rate. However, using both will usually provide a more complete estimate of your delivery costs.
Why can’t I see a run?
Check that the driver completed the manifest using the new process. The dashboard is designed to report on completed runs, and incomplete manifests may not have the final distance and duration information required.
Why is an order missing from a completed run?
Confirm that the driver marked the order as completed. Only completed orders are included in the completed-run calculations.
Why is an order’s profitability missing or inaccurate?
Check that revenue has been recorded against the order. Also confirm that the relevant driver and vehicle cost rates have been configured correctly.
Does the dashboard show my exact accounting profit?
No. It provides an operational estimate based on the revenue recorded on orders and the configured time- and distance-based delivery costs. Other expenses and overheads may need to be considered separately.
How do I get access?
Contact SolBox Support and request that the beta Cost to Serve dashboard be enabled for your account.
Start using Cost to Serve
Before requesting access, make sure you are ready to:
Enter a driver cost per hour and/or a vehicle cost per kilometre.
Include revenue on every order.
Have drivers complete manifests using the new process.
Request access to the beta dashboard.
Once enabled, you can use the dashboard to better understand delivery performance, investigate costly runs and make more informed pricing and operational decisions.
Related Articles
Reports
Overview The Reports page in the SolBox platform allows users to generate various operational reports based on order, manifest, and tracking data. Administrators and dispatchers can use this section to extract information for monitoring, analysis, or ...Prestart Reports
Prestart Reports The Prestart Reports page displays all submitted prestart inspections, including pass, fail, and repaired outcomes. This section helps track driver compliance, monitor vehicle condition, and action reported faults. Summary tiles ...Reports
Reports in SolBox can be created via the reports menu on the left side control panel. There are 7 types of report: Delivered Items Delivered Orders All Orders Tare Tracking Invoicing Report XDoc Con Note Report OBD Alarms Report Some reports are ...Vehicle Costs
Vehicle Costs allow you to set the operating rate per kilometre for each vehicle. This rate helps track the running cost of a vehicle across each run. Setting the Vehicle’s Rate per Kilometre Use the vehicle’s fuel efficiency to calculate an ...Cost Per Run: Delivery Price, Driver Hourly Rate and Vehicle KM Rate Setup
This guide explains how to configure delivery pricing, driver hourly rates, and vehicle per-kilometre rates to calculate cost per run and compare revenue against operational cost in the Manifest view. Set the Vehicle’s Rate per Kilometre Use the ...